Diving into the data
The full dataset was given to me in Excel, with well over 7,000 questions asked over a nine-month period. Initially, I attempted to build grounded theory the usual way: by painstakingly reading the questions and tagging things with codes. On a dataset this large, however, mistakes are depressingly common. Tags end up repeated, or slightly reworded when you add them, and you start losing your place fast.
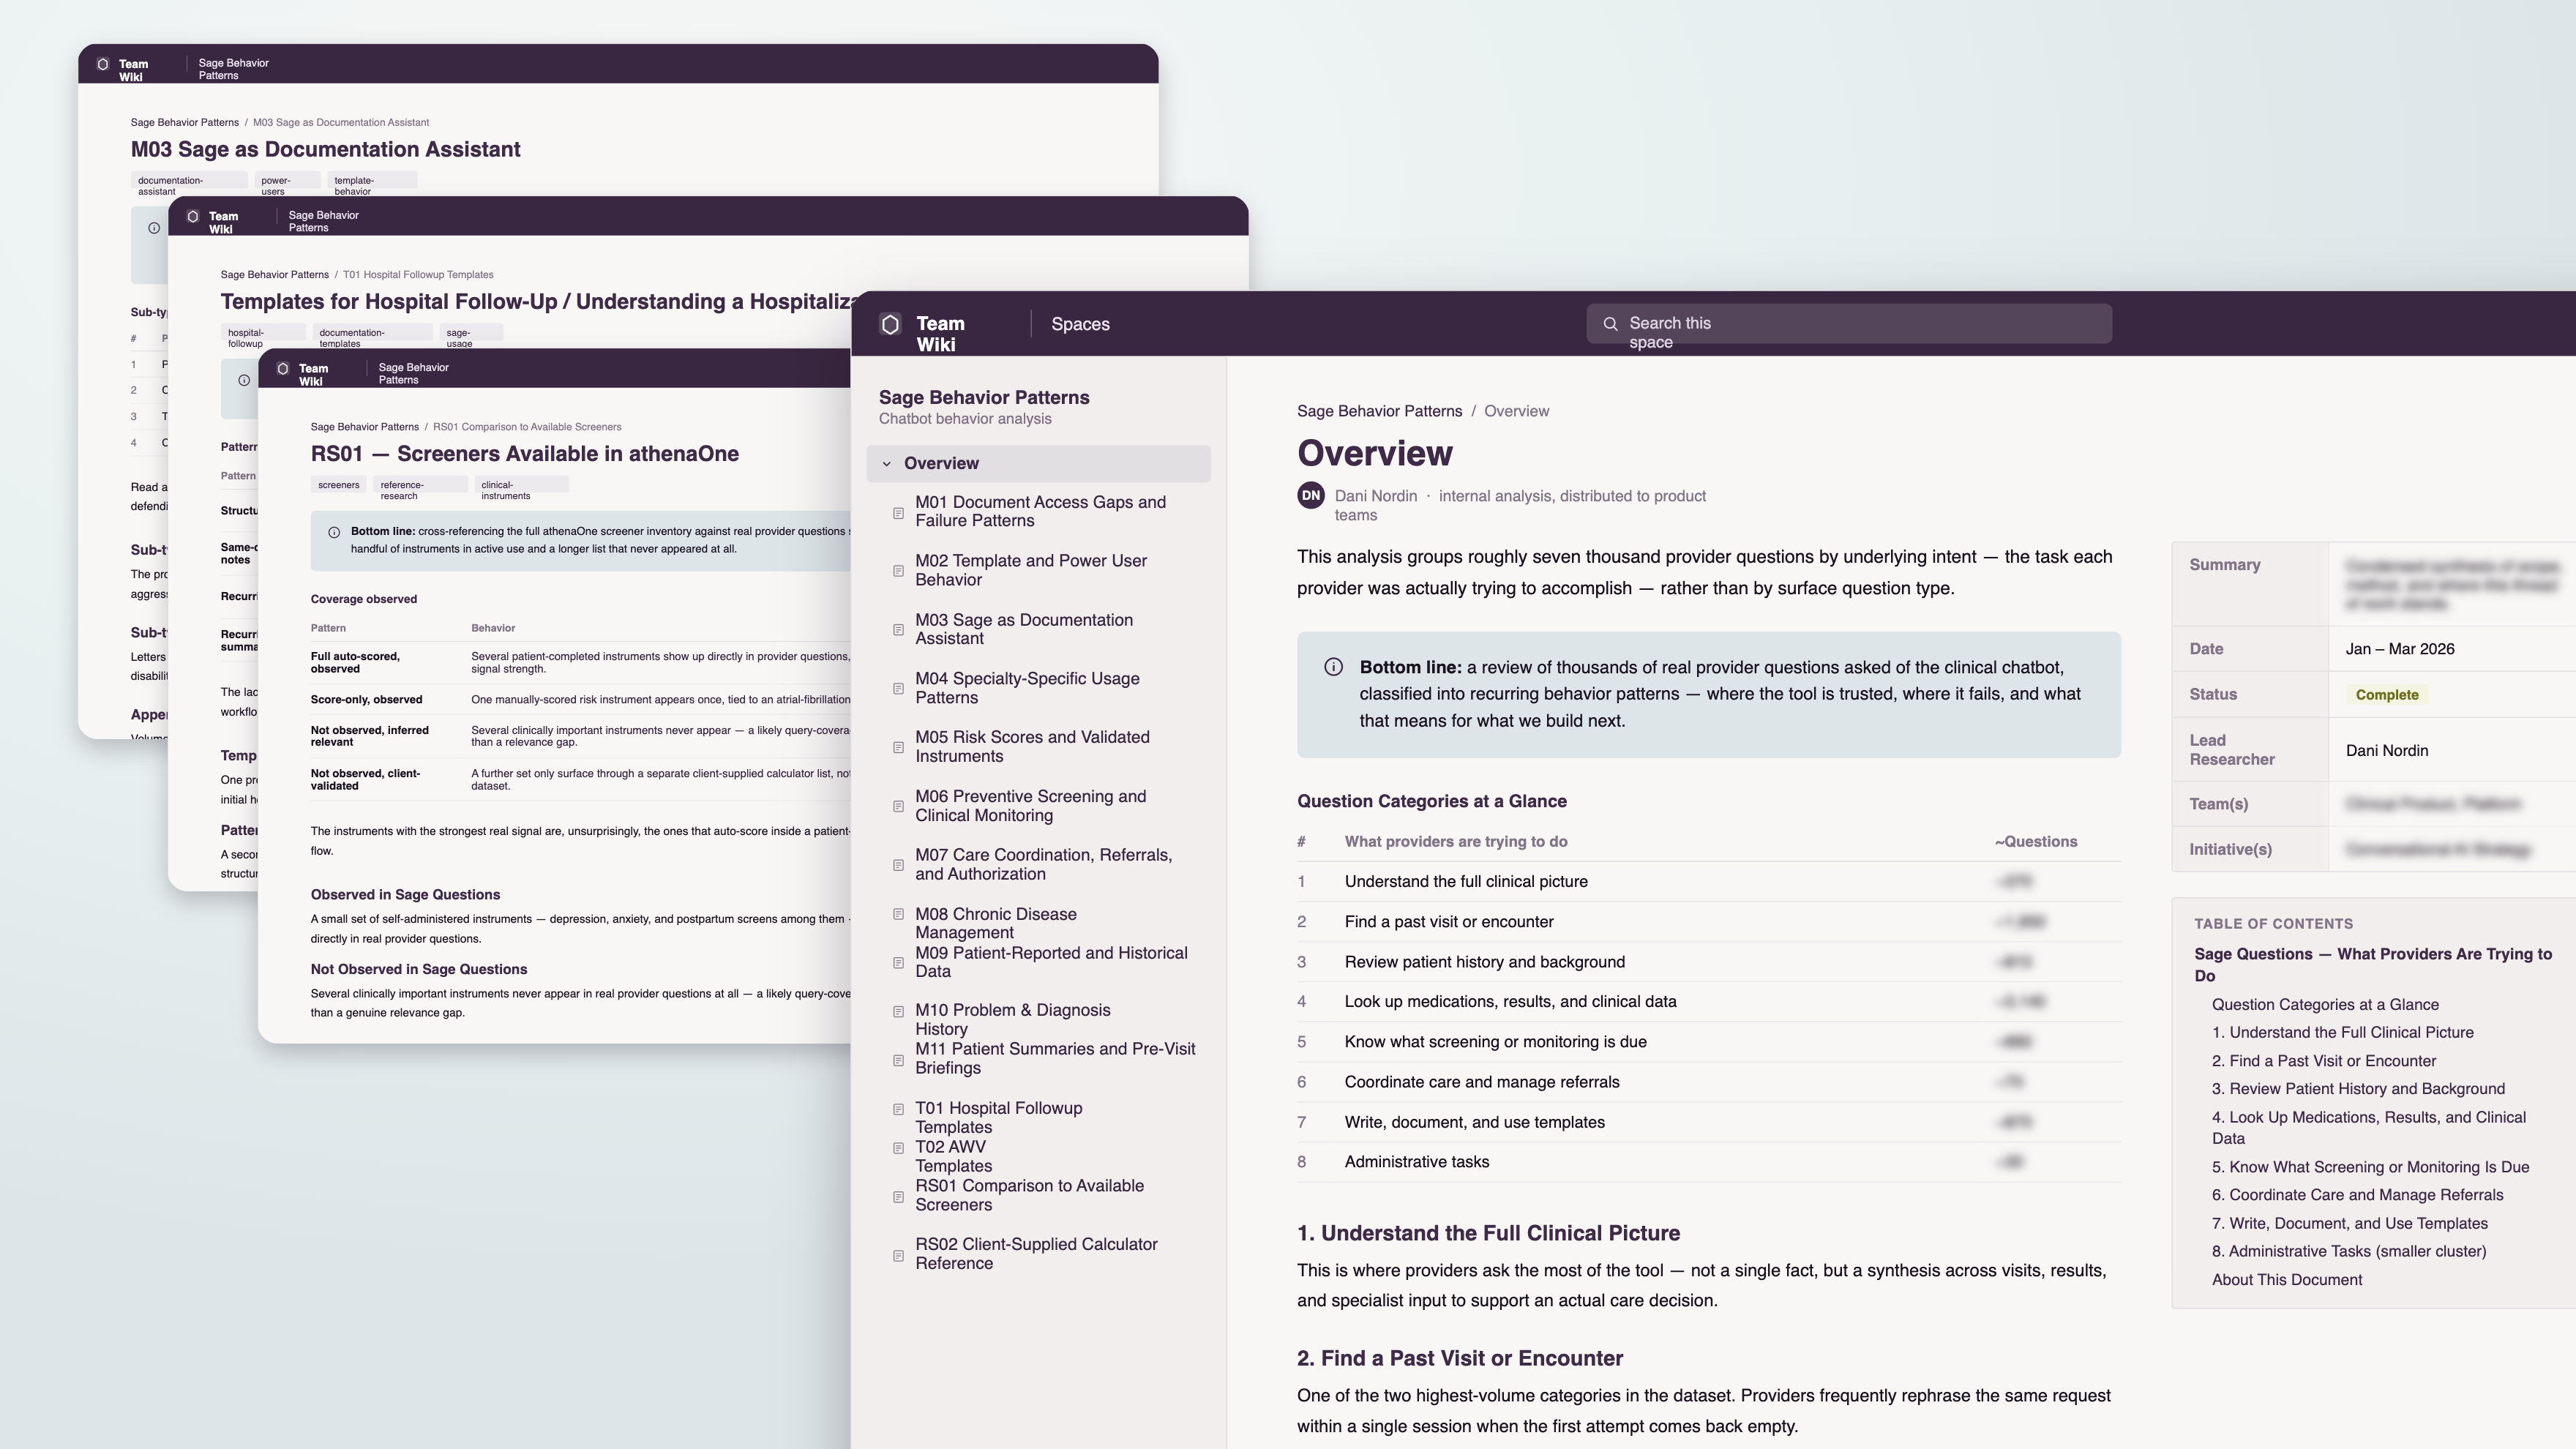
My fellow researcher, Jiaorui Jiang, had just started creating a series of prompts to analyze NPS surveys with Claude Code and VSCode. I drew from her prompts and adapted them to the Sage dataset, a process that moved through just getting a sense of what's in the data to a full categorization schema. From there, I fleshed out the categories that seemed most interesting into a structured report in Confluence, that included counts, sub-categories, and question examples for teams to review.
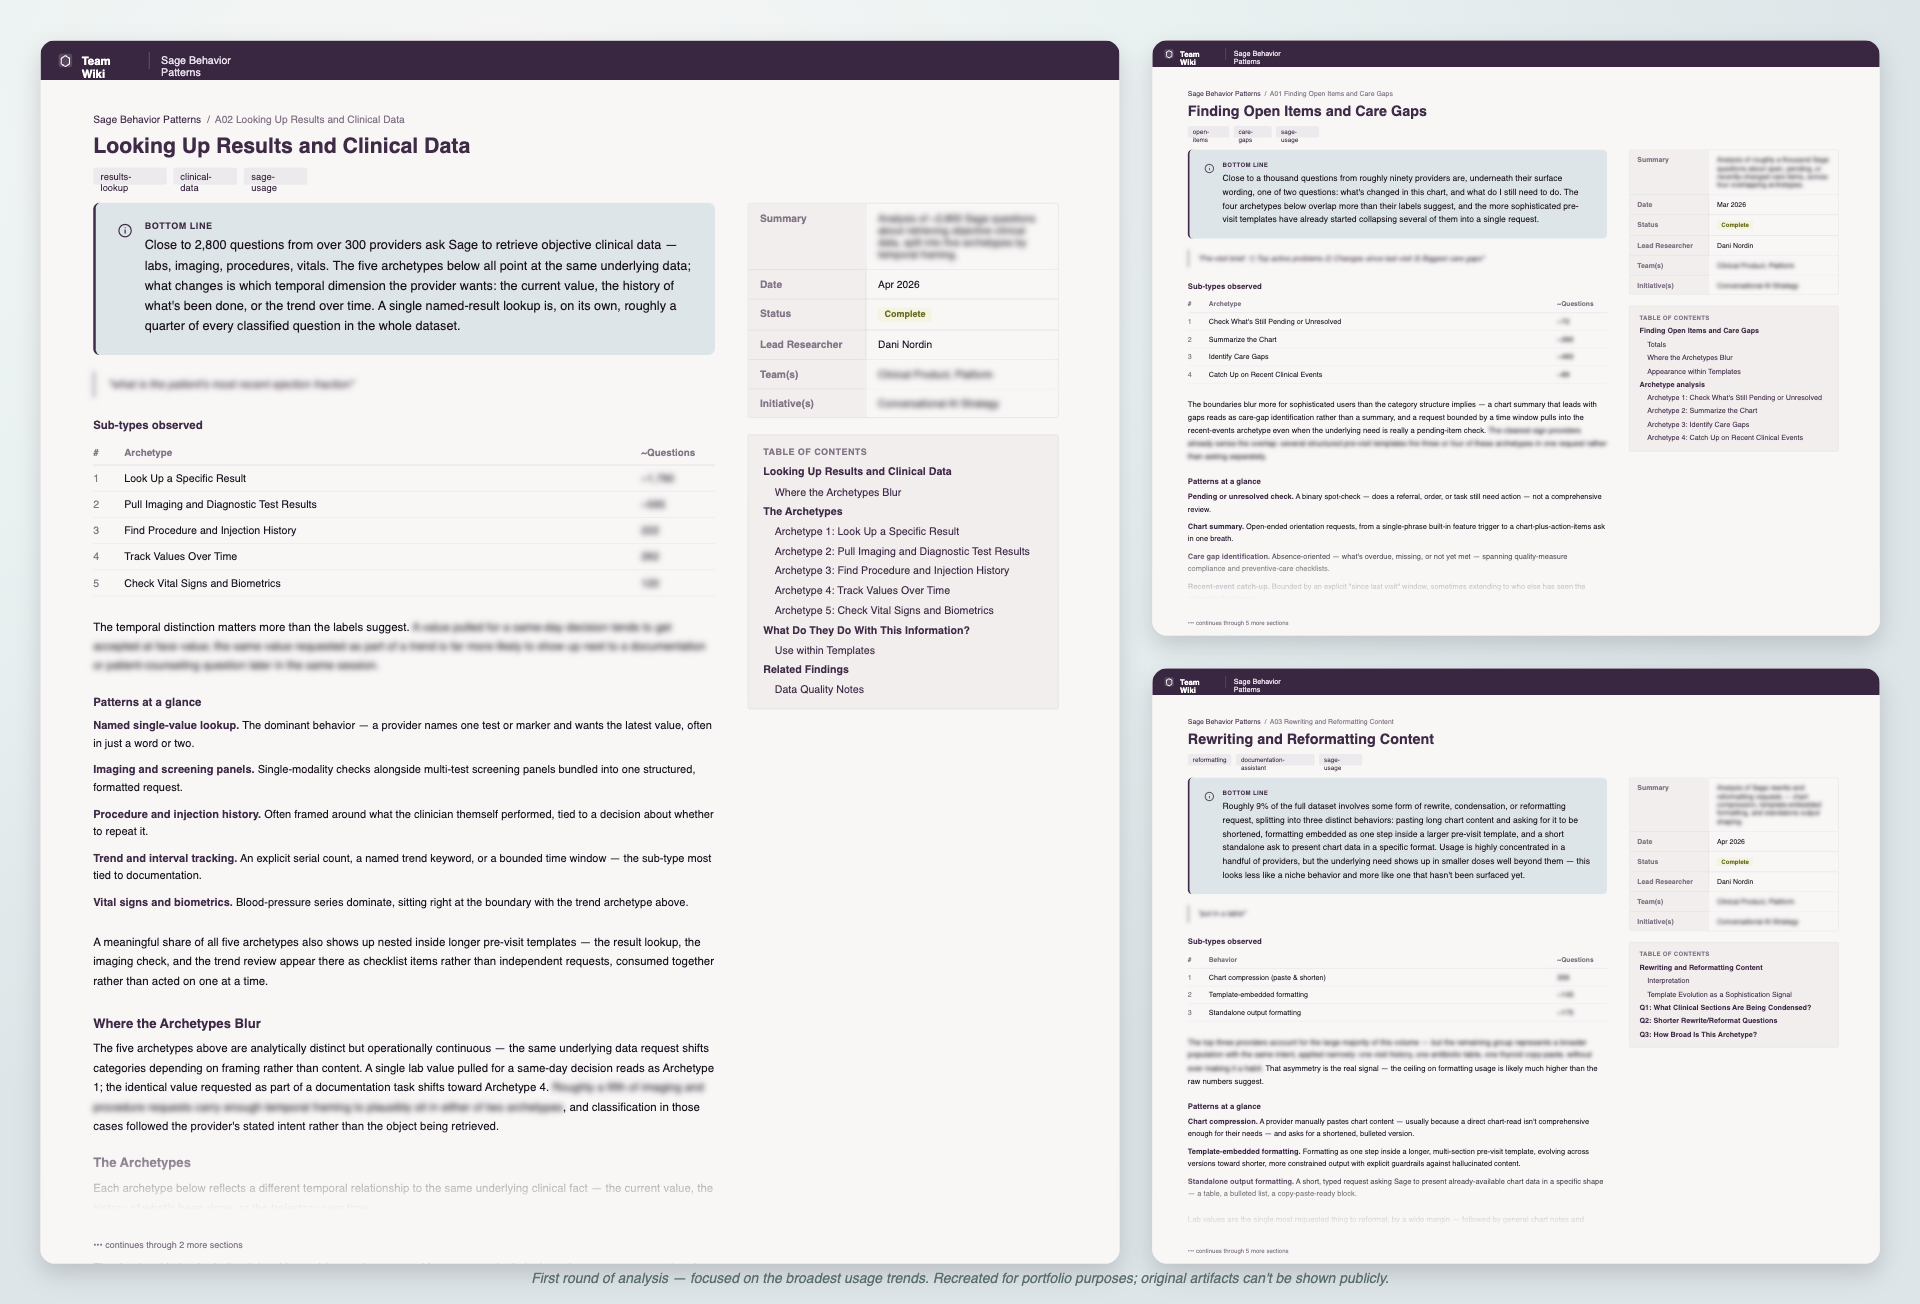
The outcome of this phase was twofold:
- We had an interesting set of data retrieval needs we could use to structure voice commands beyond the small set we already had
- We saw clear opportunities for Sage and other AI tools that went beyond looking up information and towards accelerating actual documentation
Going beyond the basics
With this new insight, I started looking for more specific patterns in the data, tying them to initiatives that zones within Clinicals were already working on. For example:
- People are commonly looking for results and preventive care information; what are they looking to learn from that?
- They're also trying to essentially re-write their note using the tool; are they also trying to structure the note from scratch — perhaps during visit prep?
Ultimately, I found about 12 core patterns among the questions, ranging from basic pre-visit briefings to tracking the progression of a given problem. For each pattern, I developed a repeatable structure for producing reports in Confluence. These reports were intended to demonstrate not just the thing people are trying to do with the tool, but the actual things they were typing into the tool to accomplish their goal.
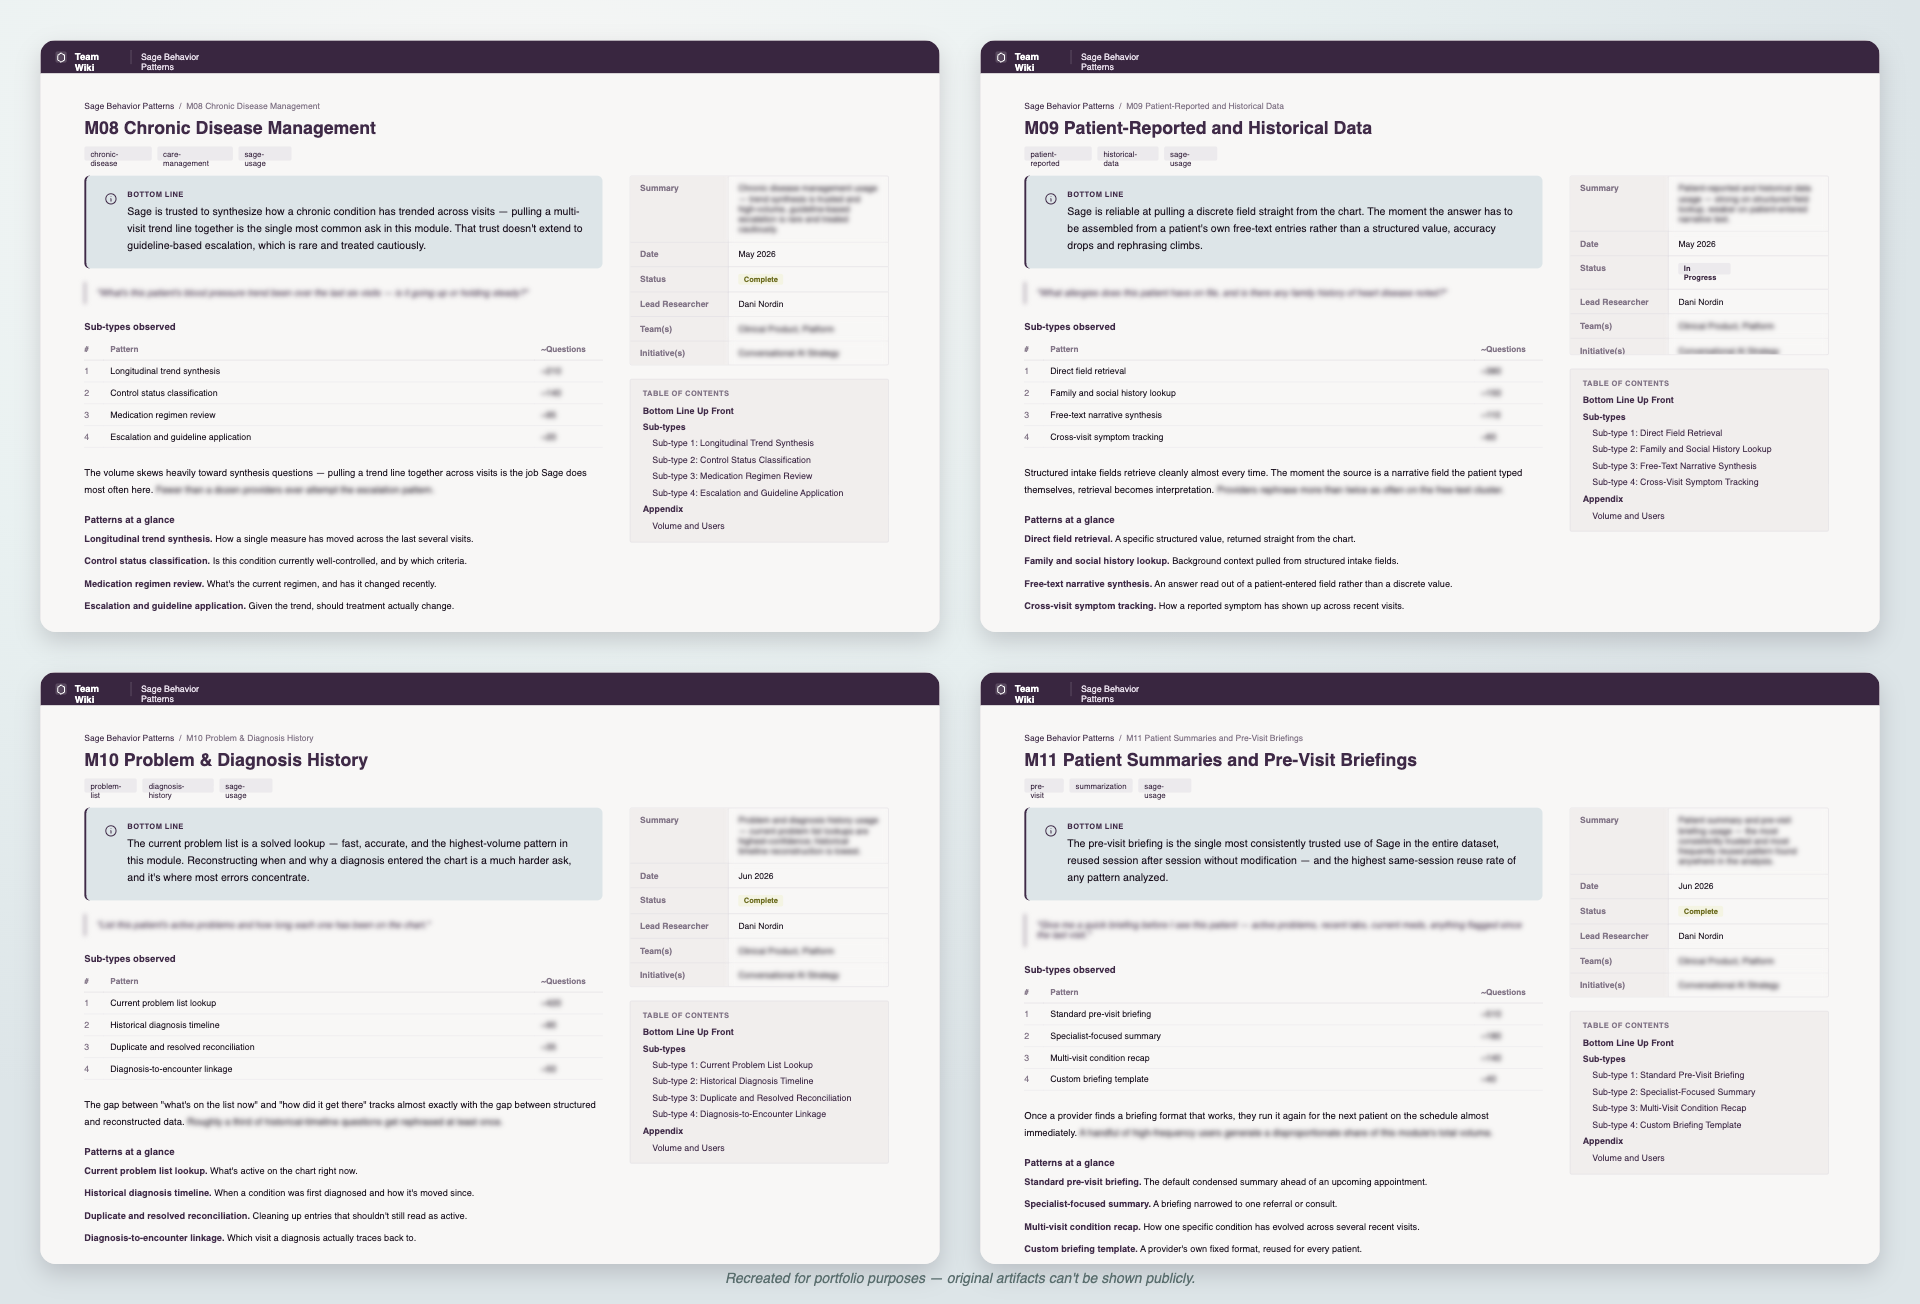
I also saw a very clear pattern of longer prompt templates used by a couple of power users, some repeated multiple times over the same day. When I dug in, I found that some of the more savvy Sage users had created their own templates for common types of visits such as Annual Wellness or Hospital Followup visits. I gave these reports to a team working on AI-driven patient briefings; they were excited to incorporate this new information into their thinking.
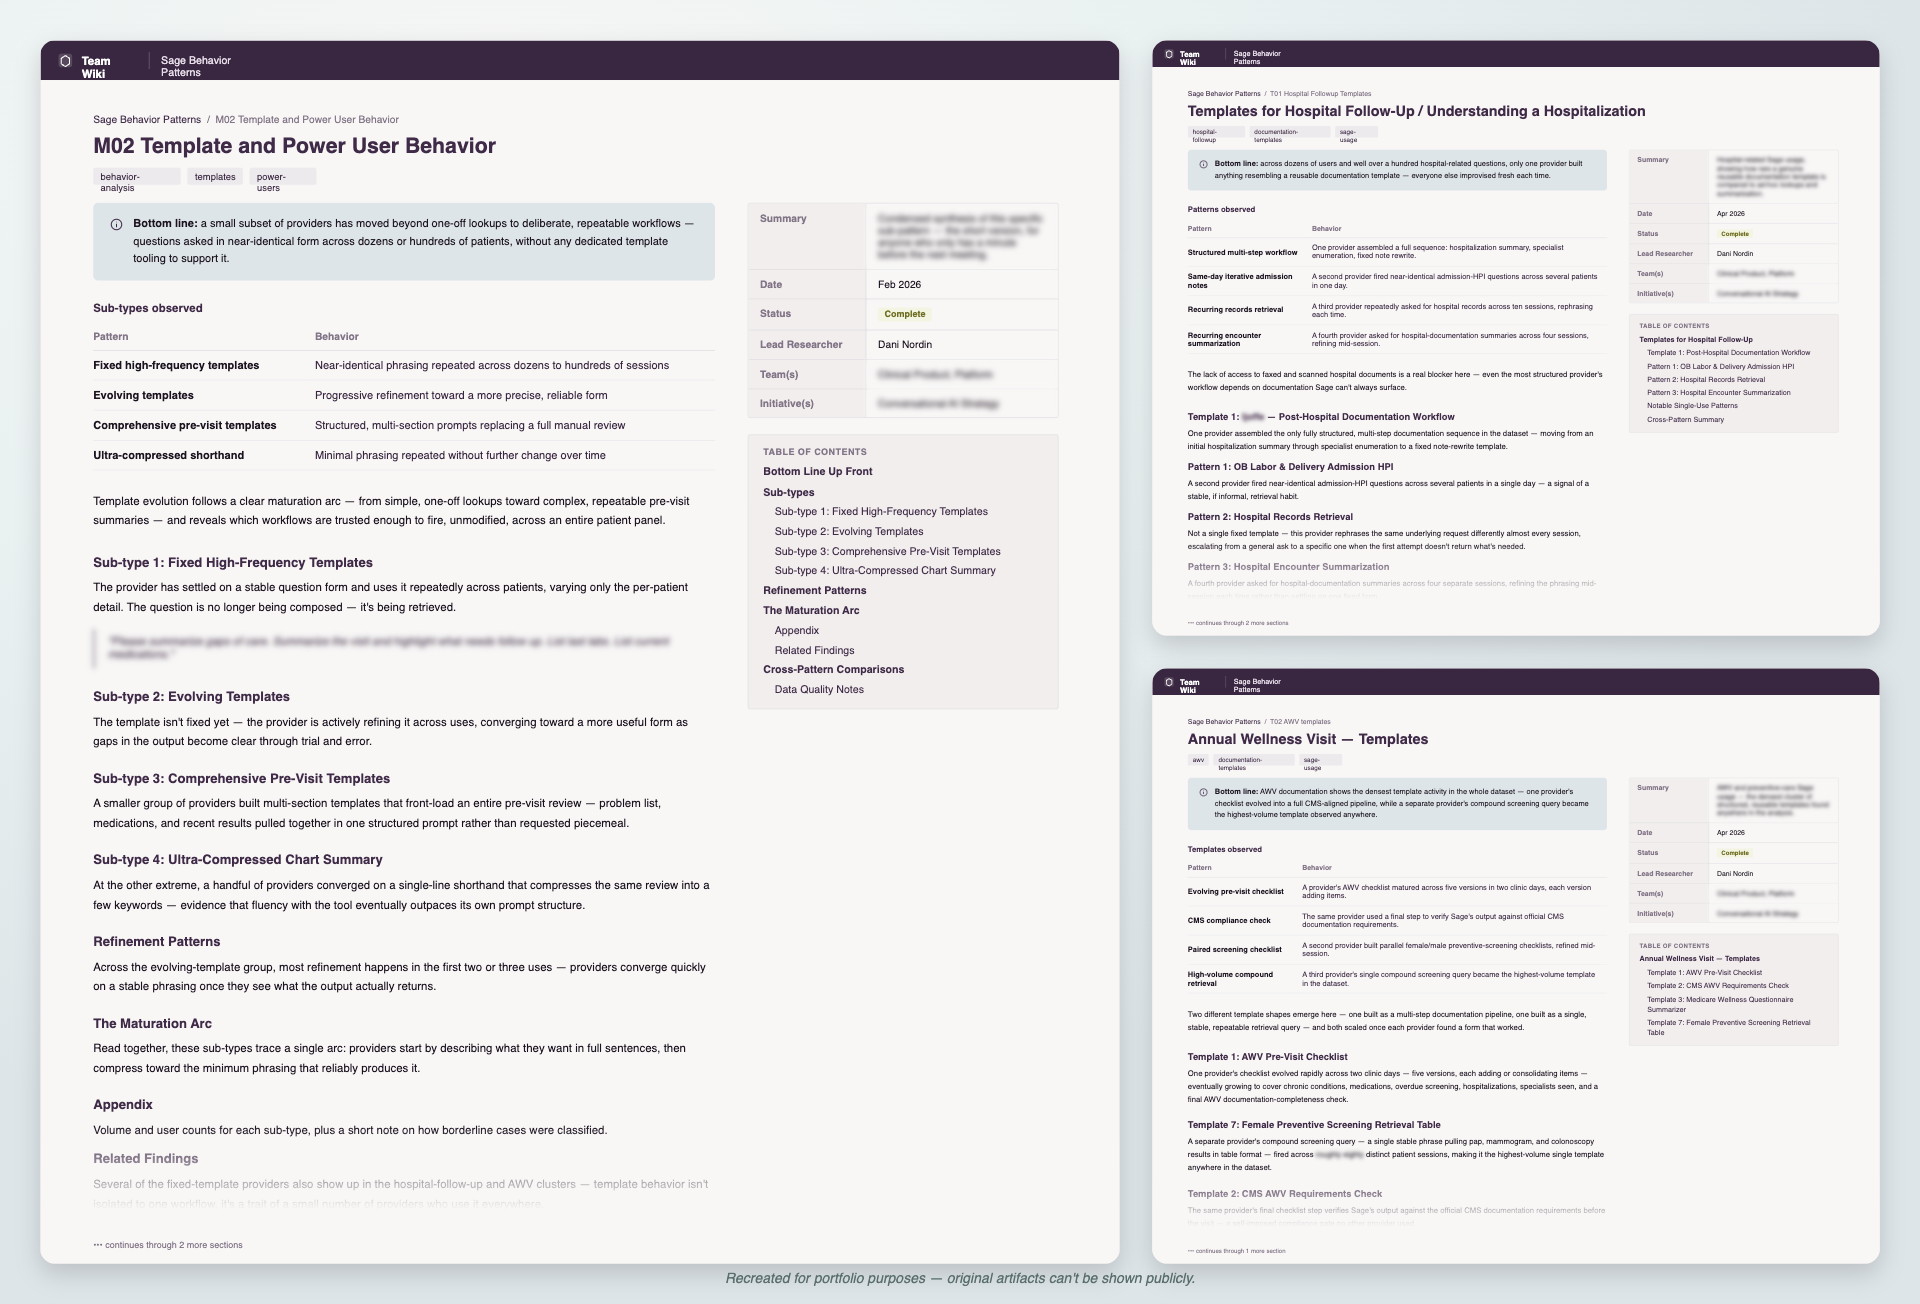
When I dug deeper into the types of preventive care and screenings people were trying to find, I also found a pattern of screeners and clinical calculators people were trying to find, which didn't yet exist. These were shared with the team working on sections of the chart related to tracking disease progress, chronic care, and other related features.
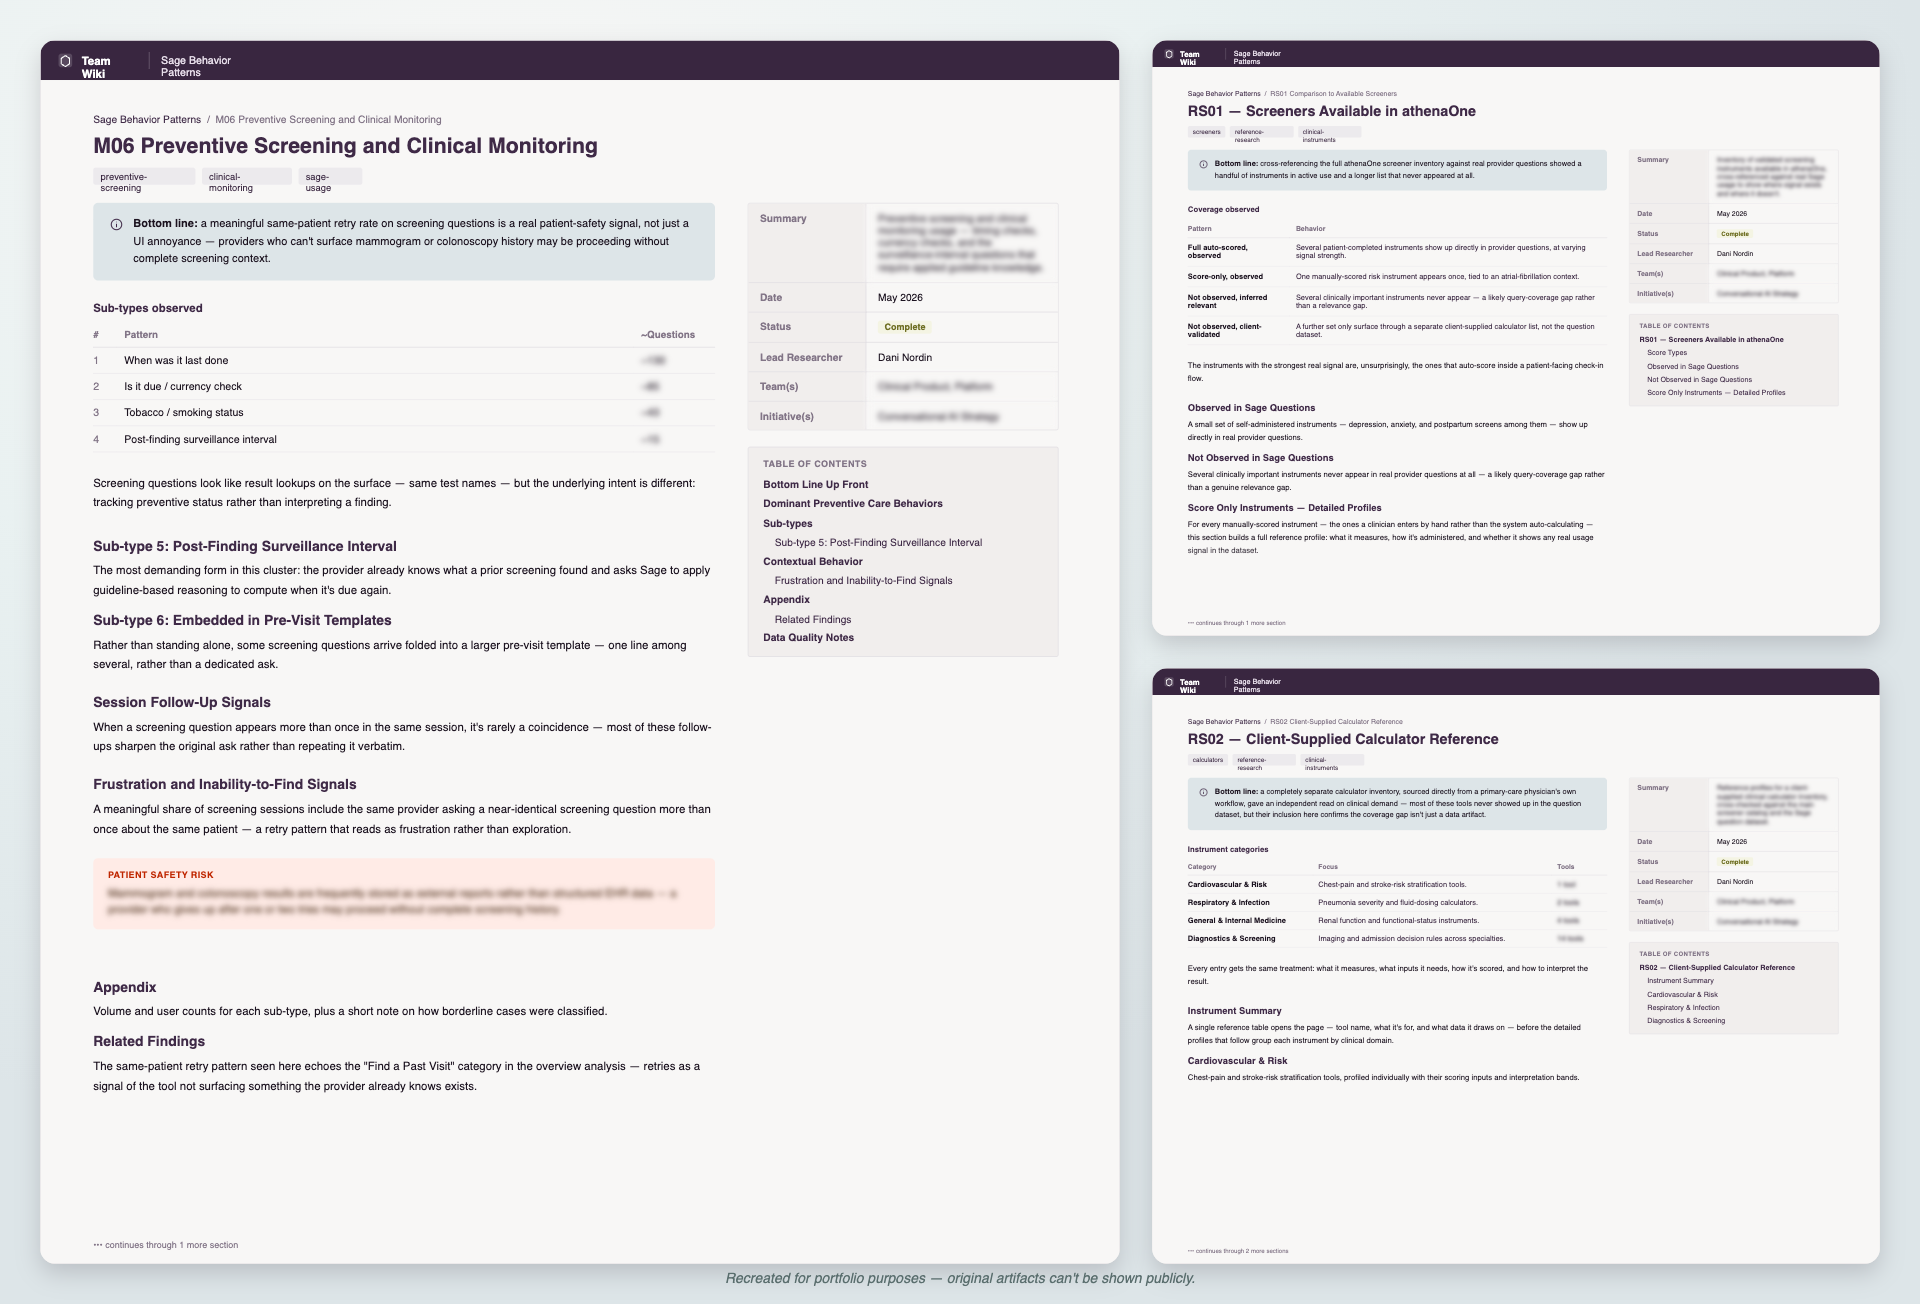
The risk score calculators were the most complex of the patterns to document. In addition to listing the calculators themselves and frequency of request, I used our internal athenaGPT tool (with Claude as the underlying model) to identify the actual clinical data used to inform the calculator, why it's used, and other key information teams would require to implement them.
Shortly after I delivered this set of insights, a team was able to build one of the highest-requested calculators into athenaOne as an AI experiment. The Clinical Content team also used the information to guide some of their work.
Outcome
This project, which began almost as an experiment for me, took on a life of its own quickly and excited teams around Clinicals. Within a few weeks, colleagues were asking me how to apply the method to similar conversational experiences they were working on. A few other follow-ons from this work:
- The Sage team started experimenting with enhancements more explicitly geared towards moving from lookup to accelerating documentation more seamlessly.
- The Voice team has a repository of potential voice commands to validate and build as part of their roadmap.
- Multiple teams in Clinicals have information they need to create, iterate, and validate the AI-powered experiences in their roadmaps.
- In spring, Principal Designer Rob Gifford invited me and a couple of other athenistas to be on a panel on design's role in the age of AI. That turned into an article on athenahealth design's Medium publication that I contributed heavily to.